A few weeks ago, we became curious about the upcoming election and wanted to find out roughly how young or old our Ulm politicians are. So we set off to see what data we could find. The result is a longer report that examines the question of how well the municipal council represents the population of Ulm and to what extent the lists up for election are statistically similar to the population. In paticular, we compared the age structures of the candidate lists, the population of Ulm and the current municipal council, In particular.
For those interested, this analysis can provide additional information alongside the goals, content and candidates of the various lists. With this small data project, we would also like to invite you to do it yourself. The data sets and the programme code for evaluating your own analyses are available on GitHub. Analyses by gender or city district, for example, are still directly possible. In addition, the current status can also be the starting point for analysing past elections.
Our results briefly summarised:
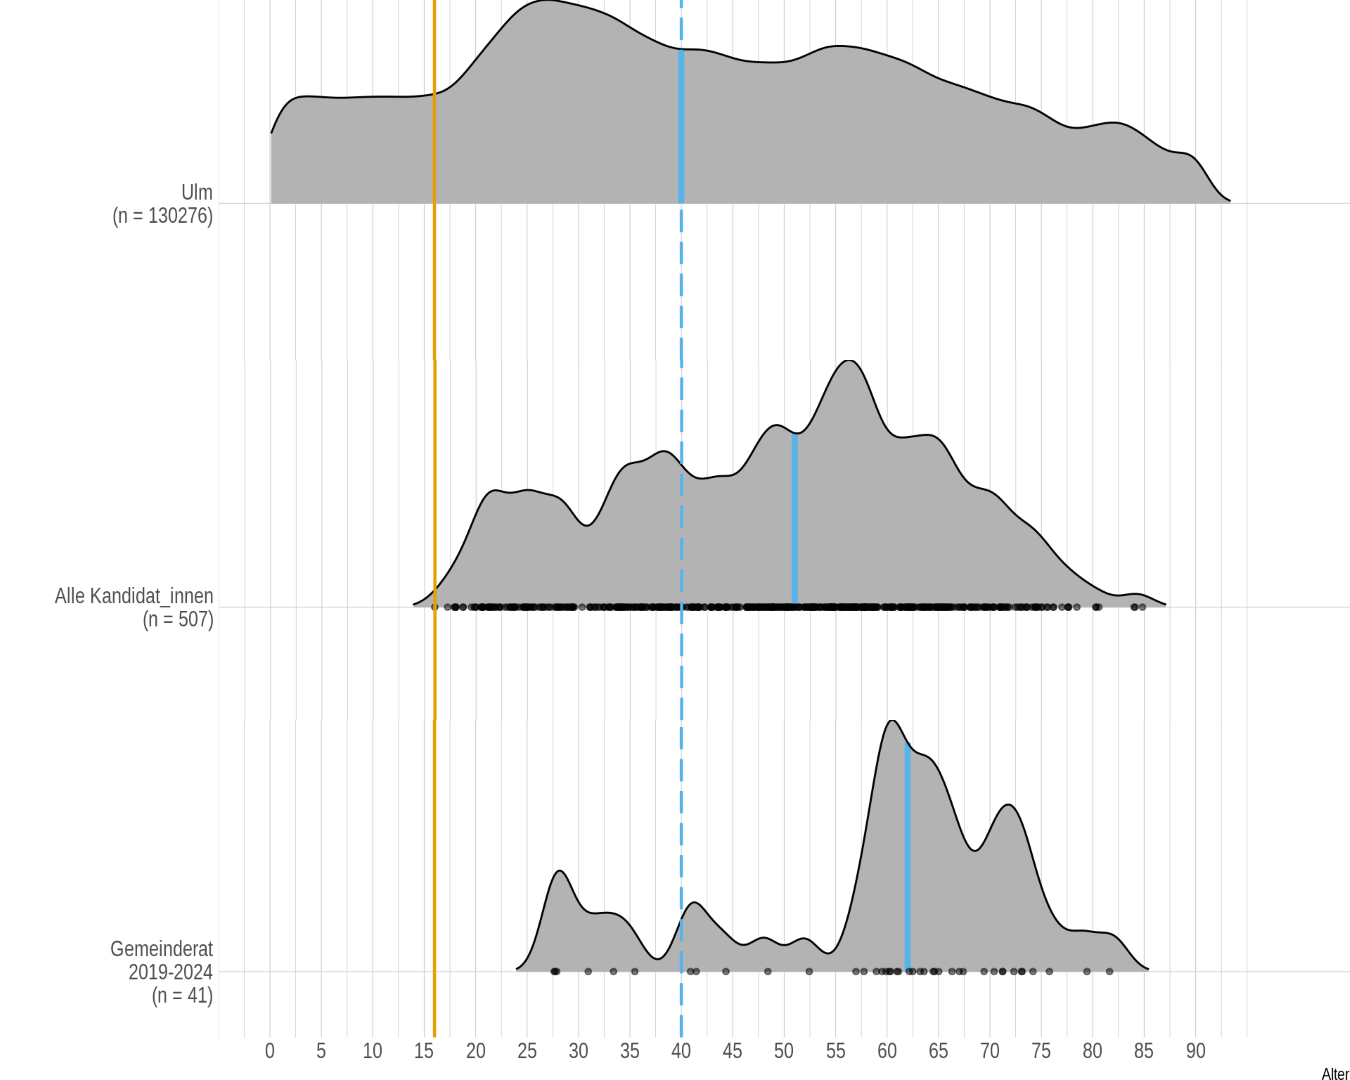
- The median Ulm resident is currently 40 years old. (Corresponding to the median age, which we have mainly used, i.e. also for the next items on this list).
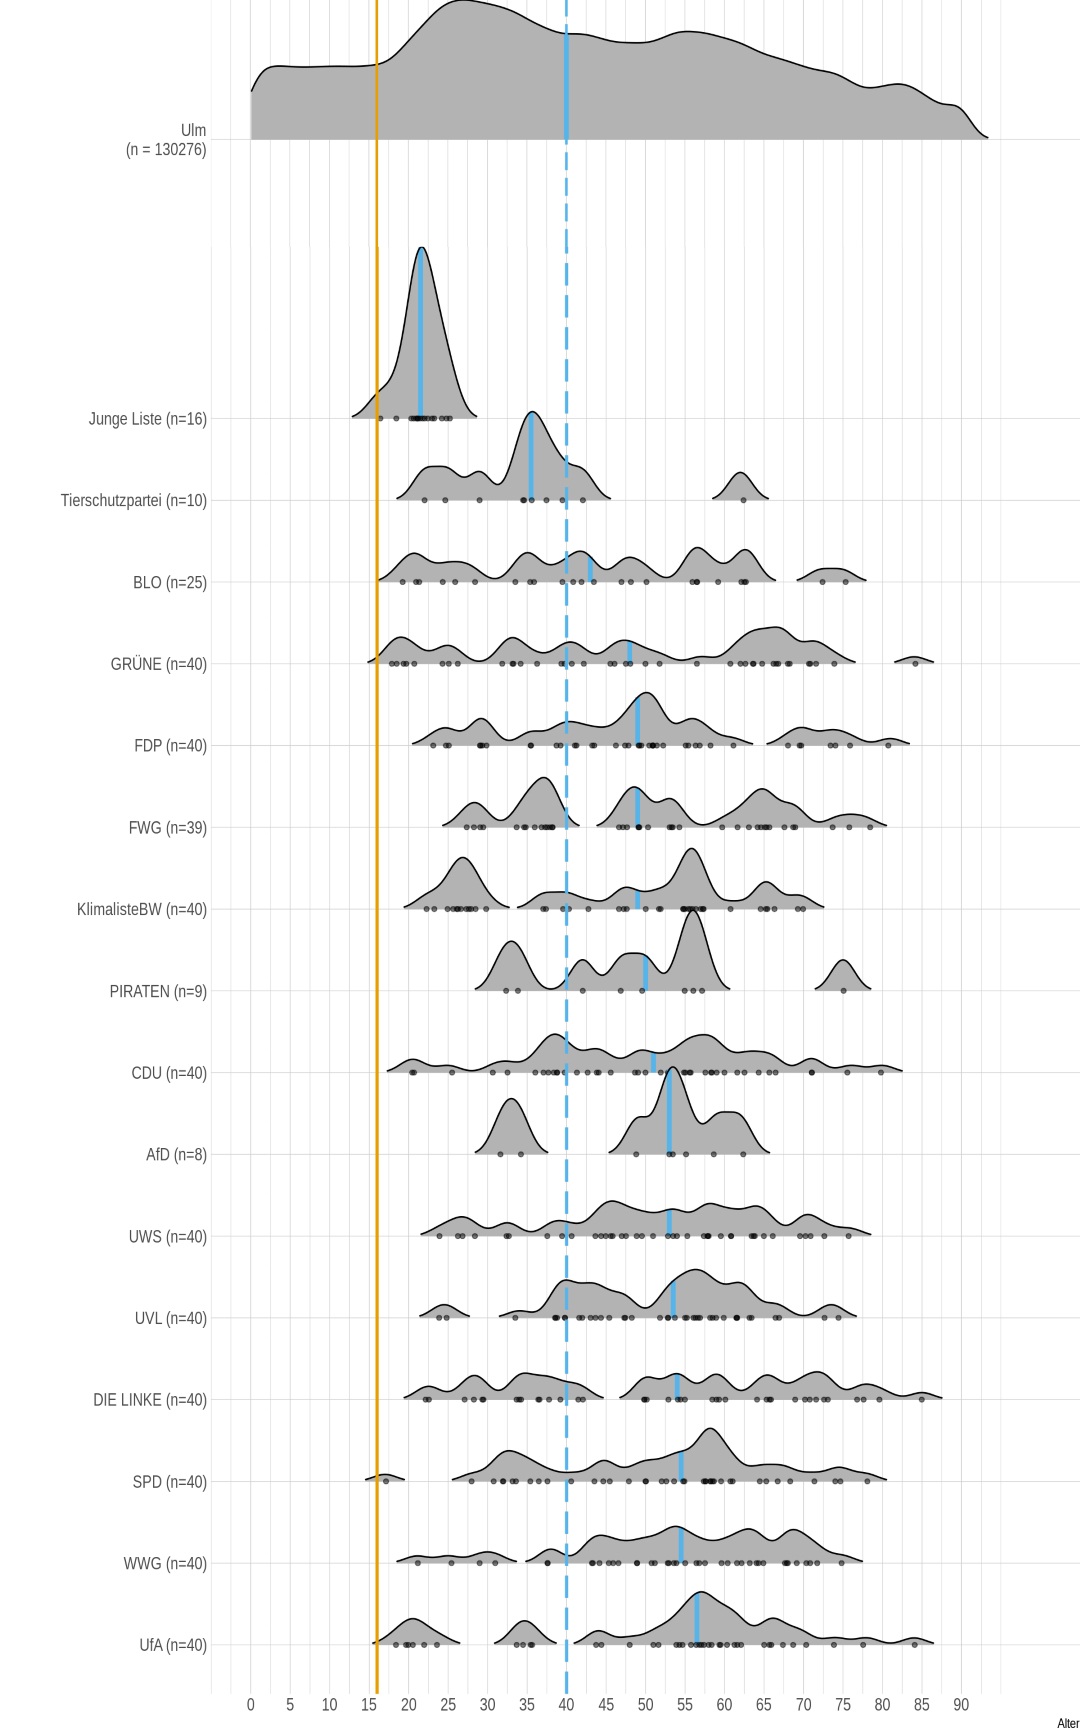
- The 507 candidates standing for election on 9 June are on average 51 years old. According to the median age, only 2 of the 16 lists are younger than the population of Ulm. If only Ulm residents of voting age, i.e. 16 and over, are considered 3 of the 16 lists are younger according to the median.
- The current municipal council is on average 22 years older than the people of Ulm. When elected in 2019, they were of course 5 years younger.
- The population of Ulm has a comparatively even age structure, while the rather small age group of 52 to 69-year-olds already accounts for half of all members of the municipal council. The 507 candidates running in June statistically better reflect the population of Ulm in terms of age.
- Of the entire population of Ulm, around 70% are eligible to vote. Of the Ulm residents of voting age, i.e. 16 and over, the figure is 83%. (These percentages are based on 92,000 eligible voters).
To read the full report click here. And since pictures often summarise many words well, the results are of course also available as a graphic: Firstly, a comparison of the age distribution of the lists running with each other (bottom 16 curves) and with the population of Ulm (top)…

… and then a comparison of the lists taken together (centre) with the population (top) and the current municipal council (bottom).

Of course, the most important thing is to go to the polls on 9 June 2024! And to give your votes to the many great candidates from the democratic lists.